面试里经常会问 QPS。QPS 是 Queries Per Second,也就是每秒请求数。对 new-api 这种服务来说,压测时不要只看 QPS,还要同时看:
- QPS:每秒能处理多少请求。
- 平均耗时:请求平均响应时间。
- P95/P99:95% 或 99% 请求的响应时间。
- 错误率:非 2xx/3xx 响应或请求失败占比。
- CPU/内存:Pod 和节点是否接近瓶颈。
- 数据库/Redis:PostgreSQL、Redis 是否被打满。
当前环境:
外部入口:https://k8s-ai.jihw.top
集群内服务:http://new-api.new-api.svc.cluster.local:3000
命名空间:new-api
监控看板:https://grafana.jihw.top/d/new-api-overview/new-api-e79b91-e68ea7-e79c8b-e69dbf
压测前检查
先确认服务正常:
kubectl -n new-api get pod,svc,ingress -o wide
kubectl -n monitoring get pod
确认 new-api、PostgreSQL、Redis 都是 Running:
kubectl -n new-api get pod
查看当前资源使用:
kubectl top nodes
kubectl top pods -n new-api
在浏览器打开 Grafana 看板:
https://grafana.jihw.top/d/new-api-overview/new-api-e79b91-e68ea7-e79c8b-e69dbf
压测时重点观察:
CPU 使用量 by Pod
内存使用量 by Pod
网络接收/发送流量 by Pod
1小时容器重启次数
PVC 使用率
Pod Ready 状态
安装 hey
本文使用 hey 做压测。它简单、轻量,适合先学习 QPS。
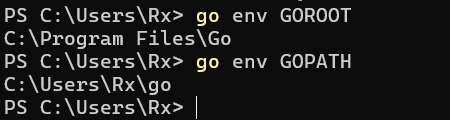
如果在 Windows 本机执行,可以用 Go 安装:
将go安装在c盘默认就会配置好环境变量。
go install github.com/rakyll/hey@latest
确认:
hey -h
如果 go install 报 Go 标准库相关错误,例如:
//go:notinheap is not allowed in the standard library
empty redeclared in this block
lfstackPack redeclared in this block
这通常不是 hey 的问题,而是本机 Go 安装目录损坏,或者新旧 Go 版本文件混在了一起。可以先跳过 Go 安装,直接下载 hey 的 Windows 预编译版本。hey 官方 README 提供了 Windows amd64 下载地址:
mkdir $HOME\bin -Force

Invoke-WebRequest `
  -Uri "https://storage.googleapis.com/hey-releases/hey_windows_amd64" `
  -OutFile "$HOME\bin\hey.exe"

$env:Path = "$HOME\bin;$env:Path"

hey.exe -h
如果想永久加入 PATH:
[Environment]::SetEnvironmentVariable(
  "Path",
  "$HOME\bin;" + [Environment]::GetEnvironmentVariable("Path", "User"),
  "User"
)
如果不想在本机安装,也可以直接在 Kubernetes 集群里临时运行 hey 容器。
外部域名压测
外部压测会经过完整链路:
本机 -> DNS -> MetalLB -> ingress-nginx -> new-api Service -> new-api Pod
先用轻量接口测试。/api/status 适合做健康检查压测:
hey -z 60s -c 10 https://k8s-ai.jihw.top/api/status
参数含义:
-z 60s   持续压测 60 秒
-c 10    并发 10 个请求
-n 10000 请求数
输出里重点看:
Requests/sec
Average
Slowest
Fastest
Status code distribution
Requests/sec 就是这次压测测出来的 QPS。
如果接口返回 404 或不适合压测,可以换成 new-api 实际存在的轻量接口,例如:
hey -z 60s -c 10 https://k8s-ai.jihw.top/v1/models
如果接口需要 API Key:
hey -z 60s -c 10 `
  -H "Authorization: Bearer 你的_API_KEY" `
  https://k8s-ai.jihw.top/v1/models
集群内 Service 压测
集群内压测会绕过外部 DNS、MetalLB、Ingress,只测 Kubernetes Service 到 Pod 的链路:
hey Pod -> new-api Service -> new-api Pod
执行:
kubectl run hey-new-api \
  -n new-api \
  --rm -it \
  --restart=Never \
  --image=rakyll/hey -- \
  -z 60s -c 10 \
  http://new-api.new-api.svc.cluster.local:3000/api/status
如果需要 API Key:
kubectl run hey-new-api \
  -n new-api \
  --rm -it \
  --restart=Never \
  --image=rakyll/hey -- \
  -z 60s -c 10 \
  -H "Authorization: Bearer 你的_API_KEY" \
  http://new-api.new-api.svc.cluster.local:3000/v1/models
外部域名压测和集群内压测可以对比:
外部 QPS 明显更低:可能瓶颈在 ingress-nginx、网络、DNS、TLS。
集群内 QPS 也低:可能瓶颈在 new-api Pod、PostgreSQL、Redis 或上游模型接口。
压测聊天接口
如果要压测 OpenAI 兼容接口,可以测:
/v1/chat/completions
示例:
hey -z 60s -c 5 `
  -m POST `
  -H "Content-Type: application/json" `
  -H "Authorization: Bearer 你的_API_KEY" `
  -d "{\"model\":\"你的模型名\",\"messages\":[{\"role\":\"user\",\"content\":\"hello\"}],\"stream\":false}" `
  https://k8s-ai.jihw.top/v1/chat/completions
注意:AI 聊天接口的 QPS 不一定高,因为一次请求可能要等待上游模型返回。面试时可以这样说:
AI 网关不能只看 QPS,还要看平均响应时间、P95/P99、错误率、上游模型限流、Token/s。
如果是流式接口,hey 不太适合精细统计 Token/s,后续可以用 k6 或自己写脚本统计首 token 延迟和完整响应时间。
阶梯压测
不要一上来就高并发。建议从低到高逐步压:
hey -z 60s -c 5  https://k8s-ai.jihw.top/api/status
hey -z 60s -c 10 https://k8s-ai.jihw.top/api/status
hey -z 60s -c 20 https://k8s-ai.jihw.top/api/status
hey -z 60s -c 50 https://k8s-ai.jihw.top/api/status
每一轮压测后都记录:
并发数
QPS
平均耗时
P95/P99
错误率
new-api CPU
new-api 内存
PostgreSQL CPU/内存
Redis CPU/内存
如果出现下面情况,就不要继续加压:
错误率明显上升
P95/P99 延迟突然变高
new-api Pod CPU 接近上限
Pod 重启次数增加
PostgreSQL 或 Redis 资源明显升高
Ingress 返回 502/503/504
压测时查看日志
查看 new-api 日志:
kubectl -n new-api logs deploy/new-api --tail=100 -f
查看 Ingress 日志:
kubectl -n ingress-nginx logs deploy/ingress-nginx-controller --tail=100 -f
查看 Pod 事件:
kubectl -n new-api describe pod -l app=new-api
查看资源:
kubectl top pod -n new-api
kubectl top nodes
结果记录模板
可以按下面格式记录:
压测时间:2026-06-01 16:45
压测入口:https://k8s-ai.jihw.top/api/status
压测工具:hey
持续时间:60s

并发数:10
QPS:xxx
平均响应时间:xxx ms
P95:xxx ms
P99:xxx ms
错误率:0%

new-api CPU:xxx
new-api 内存:xxx
PostgreSQL CPU:xxx
Redis CPU:xxx

结论:
在并发 10、持续 60 秒时,服务稳定,无错误,P95 延迟可接受。
面试回答示例
可以这样回答:
我会先区分压测入口,是测 Ingress 外部入口,还是测集群内 Service。
然后用 hey 或 k6 做阶梯压测,例如并发 5、10、20、50,每轮持续 1 到 5 分钟。
压测时不只看 QPS,还会看 P95/P99 延迟、错误率、Pod CPU/内存、PostgreSQL、Redis 和 Ingress 日志。
如果 QPS 上不去,我会通过外部入口压测和集群内 Service 压测做对比,判断瓶颈是在网络/Ingress,还是应用/数据库/缓存。
对于 new-api 这种 AI 网关,还可以补充:
如果压测的是模型调用接口,我还会关注上游模型限流、首 token 延迟、完整响应耗时和 Token/s,因为这类接口不是普通 CRUD API,QPS 不能单独说明性能。
后续优化方向
当前监控看板主要使用 Kubernetes 基础指标。后续可以继续补:
- 给 ingress-nginx 开启 metrics,统计
k8s-ai.jihw.top的 HTTP QPS、状态码、响应耗时。 - 给 new-api 暴露应用级
/metrics,统计业务请求数、错误数、模型调用耗时。 - 使用 k6 编写更接近真实业务的压测脚本。
- 配置 Alertmanager 告警,例如错误率过高、Pod 重启、PVC 空间不足。